


An interactive map, which displays the properties locations for sale in the US neighbourhood – Bellingham.
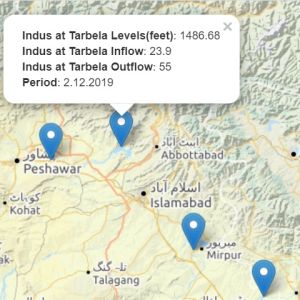
An interactive map, showing inflows and outflows data in Pakistan. The user can select from 5 different base maps.

An interactive map with 5 filters about the properties, which the Canadian company “Chrisitne Gauthier” sells. The images in the popups are loaded from Google Street View.

An interactive map which shows the nursing homes in the Minnesota state. The map is created for the “Elder Voice Family Advocates”, which is fighting to improve the care and protection of elders and vulnerable adults in long-term care facilities through better laws, penalties, and enforcement.

An interactive map of listeners and radio servers around the world. The data is loaded at some intervals from an external API.

Online map of animated routes between points of interest in San Francisco, USA

An interactive map with a time slider, which allows the user to track the spread of the virus in Bulgaria

An interactive map which shows the agencies, which work with the US company “Intelligent Pole Base”.